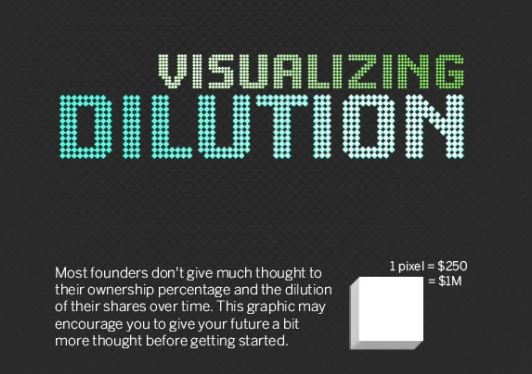
This is a great infographic from visual.ly showing how dilution works in a start up company.
Click through for the full graphic.
This is a great infographic from visual.ly sh...
This is a great infographic from visual.ly showing how dilution works in a start up company.
Click through for the full graphic.