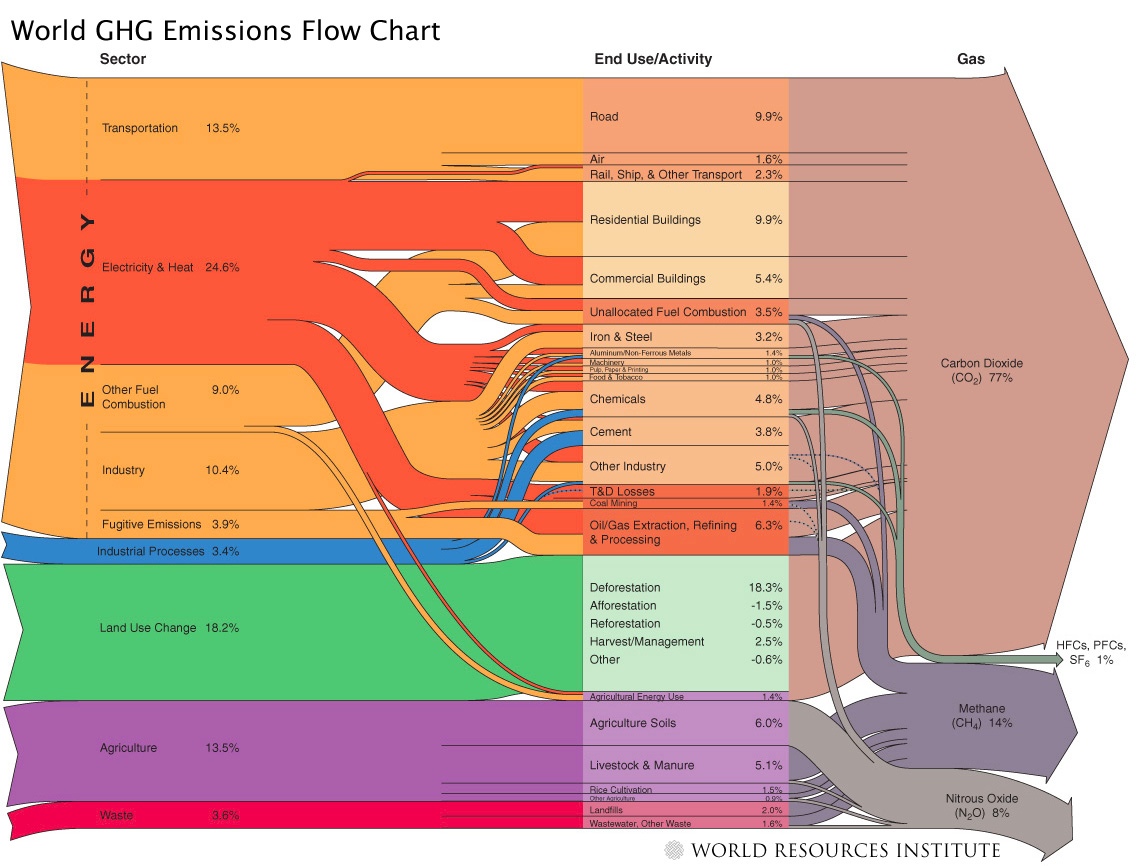
This graphic shows where the world’s carbon emissions come from and where they go. Visualizations like this are such a powerful way to look at data that’s hard to grasp in text form. It would be interesting if they took the resulting emissions and correlated that to environmental impact. However, I suppose that would be subject to interpretation, whereas, in it’s current form, it’s simply facts.
Found via @NickPinkston