2012: The Year in Graphs
The Washington Post's "Year in Graphs" is a wid...
The Washington Post’s “Year in Graphs” is a wide ranging article, covering politics, the budget, education, social security and many other topics. A very interesting read for people, like myself, who REALLY like graphs.
Robert Greenstein — president, Center on Budget and Policy Priorities
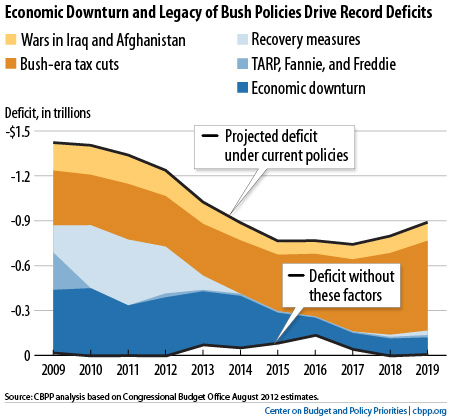
“This is our ‘parfait’ chart that shows what drives our record deficits. We’ve updated it periodically since its first release, since we think it really captures how we got here, as we debate the best ways for us to address the issue.”
